Purpose:
OSP is committed to providing high quality and timely service to the research community and to making the best use of available resources. However, please be aware that most of our activities involve people from other internal and/or external organizations which also impact processing times. This information reflects average processing times and is being provided to help members of the UVA research community plan related actions. Also, the volume of actions in any category varies throughout the year, and volume impacts duration (time to completion).
The information on this page is a work in progress. We will continue to expand and refine what we are reporting over time.
In Process Action Trend Chart: 4/23/2022 - 4/21/2024
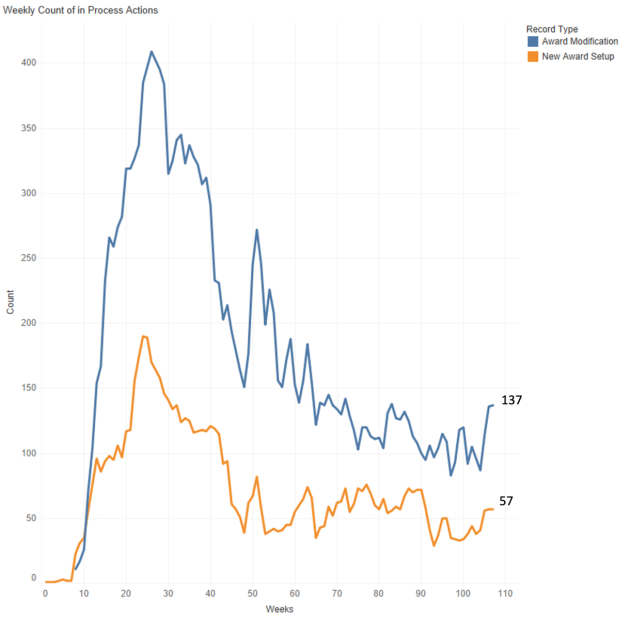
This chart shows the number of process actions each week since April 23, 2022. Except for a sharp increase in award modification requests around 50 weeks after launch, process actions for new award setups and modifications peaked between weeks 20 and 30, decreasing between weeks 40 and 50, and stabilizing during the second year after launch.
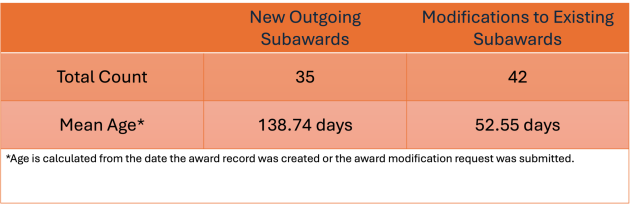
In Process Actions as of 4/21/2024
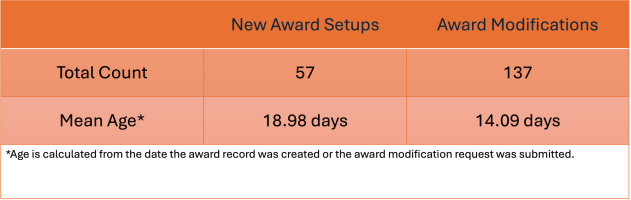
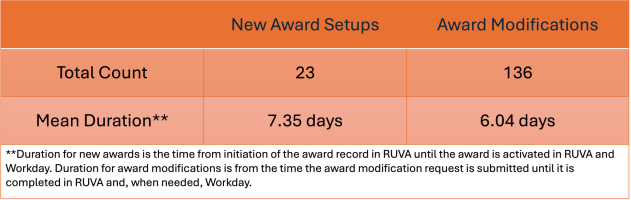
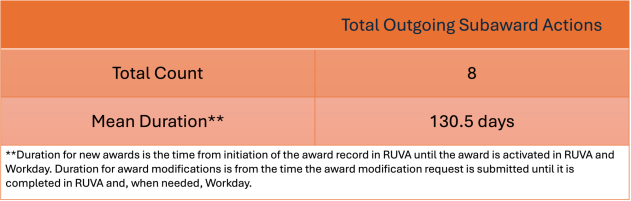
Completed Actions Reporting Week 4/15/2024 - 4/21/2024
Note: Counts and means are highly variable from week to week.
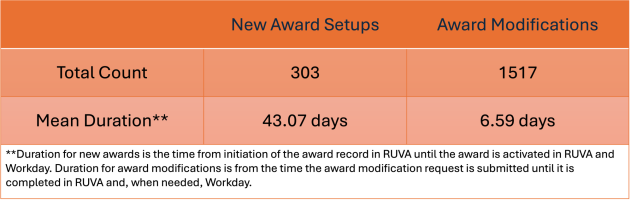
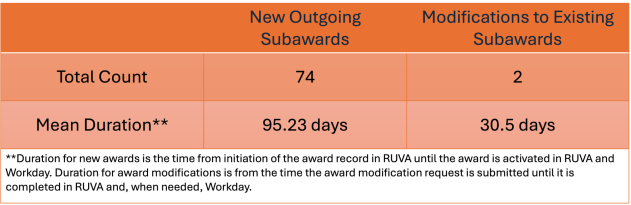
Completed Actions Q1 2024 (January - March)
In Process Actions as of 4/21/2024
Completed Actions Reporting Week 4/15/2024 - 4/21/2024
Note: Counts and means are highly variable from week to week.
Completed Actions Q1 2024 (January - March)
The following table presents data about processing times for the most common agreement types: clinical trial (CTA), confidentiality (CDA), data use (DUA), material transfer (MTA), and sponsored research (SRA) agreements. This data is limited to agreements submitted in April - June 2023 as those periods are >80% fully executed (FE) and, therefore, better convey the mean duration (days) for processing from creation of the agreement record until FE. Means will continue to change until 100% of submitted agreements have been either discarded (unable to reach agreement) or FE.
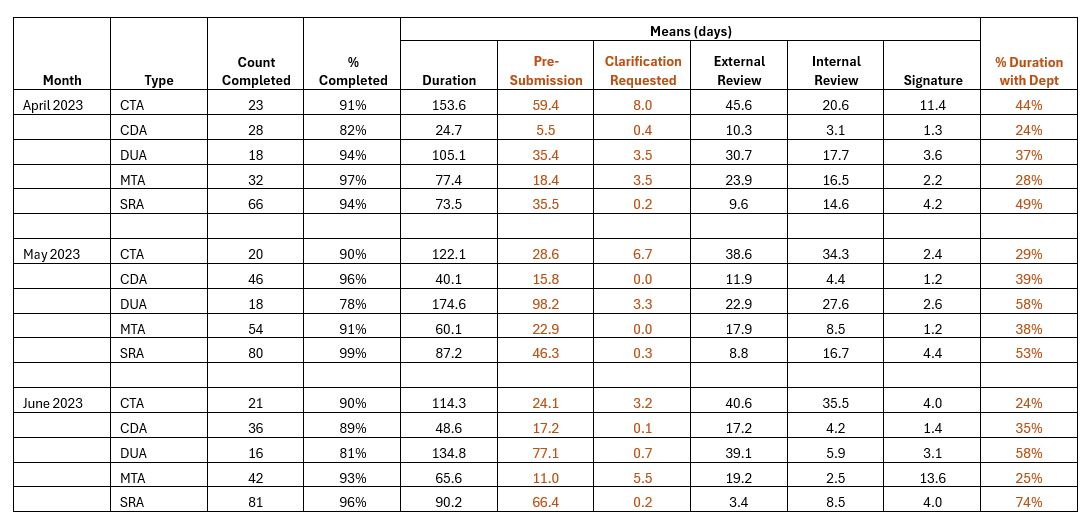
Note 1: Means are highly variable among agreements in large part due to time spent in statuses outside of OSP's direct control. Pre-Submission and Clarification Requested (orange above) reflect time assigned to the department or study team. External Review reflects time spent assigned to the external party(ies) for negotiation, review, and approval.
Note 2: Signature Processing may include internal and external processes depending on the mechanism used to secure signatures (e.g., DocuSign, email, or hard copies). It also includes time taken for the UVA PI to sign acknowledgement. It may also be inflated when agreements are held for additional documentation (e.g., compliance verification).
Check back for post award metrics and reports.